Python Challenge, Level 9

Continuing on our journey through the challenges at PythonChallenge.com, here are the next few levels that we completed during the last meet.
SPOILERS! As stated in our last post, We will discuss the challenges, the clues, and how we solved each level. We discovered other sites have done the same thing but chose to solve these on our own. It’s more fun that way. Afterward, it’s interesting to go back and see how others have solved the same problem, but we recommend you solve the problems on your own.
On the page for this challenge is a photo which shows a view of a lake and a tree. The outline of the tree is marked with some square dots. As it wasn’t immediately apparent what the dots were for, we looked for further hints by inspecting the page code. Inside we found the following hint:
<!--
first+second=?

first:
146,399,163,403,170,393,169,391,166,386,170,...

second:
156,141,165,135,169,131,176,130,187,134,191,...
-->
Our first reaction was to add the two rows of numbers. This did not make much sense, as both had different lengths.
By counting the numbers in each row we found out that both contained an equal count of numbers, so we tried to use them as coordinates of a point, as the square dots on the photo suggest.
For plotting the dots we choose the library mathplotlib. The method
pyplot.plot accepts the x/y-coordinates as arrays. As the numbers in first and second can be seen as one-
dimensional arrays, we looked for a solution to slice each of them into two arrays, for the x and y coordinates. We
were already familiar with the NumPy which provides a method [r_]
(https://www.numpy.org/devdocs/reference/generated/numpy.r_.html) library, which we had used in a previous project. It
happened to provide the exact functionality we wanted.
Translates slice objects to concatenation along the first axis.
A small example: From first we want beginning from index 0 every second number to be the value for the x-axis
first = [146,399,163,403,170,393,169,391,166,386]
and beginning from index 1 every second number to be the value for the y-axis.
first = [146,399,163,403,170,393,169,391,166,386]
To separate the values from list first we use the slice notation start:stop:step (e.g. first[0::2]) would create a
list with the x values).
import numpy

first = [146,399,163,403,170,393,169,391,166,386]
x1 = first[0::2]
y1 = first[1::2]
print('{}: {}'.format('x1', x1))
print('{}: {}'.format('y1', y1))
output
x1: [146, 163, 170, 169, 166]
y1: [399, 403, 393, 391, 386]
Combining it with the numpy.r_ method two arrays can be created from each list.
x1 = numpy.r_[first[0::2]]
y1 = numpy.r_[first[1::2]]
x2 = numpy.r_[second[0::2]]
y2 = numpy.r_[second[1::2]]
The resulting arrays can then be passed as parameters to the pyplot.plot method.
pyplot.plot(x1,-y1)
pyplot.plot(x2,-y2)
To show the plotted data we call the method pyplot.show().
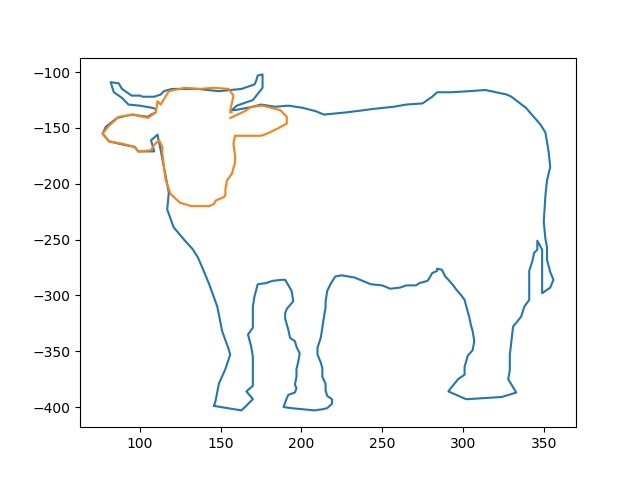
This looks like the shape of a bull. And gives us the name of the next challenge page. So we change the url from
…/pc/return/good.html to …/pc/return/bull.html and are ready for the next challenge.